
Figure 5.
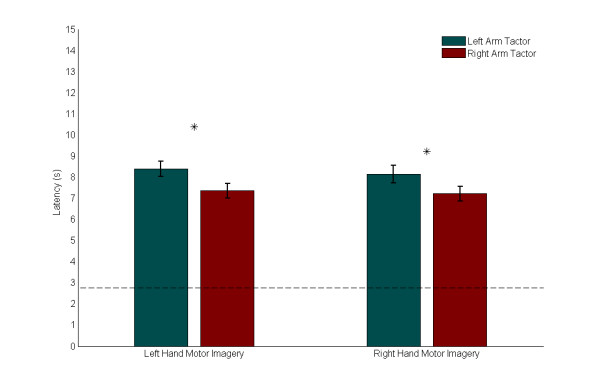
Latency Comparison. Means and standard errors for average latencies across all subjects, separated by motor imagery and tactor location. The lower dotted line indicates the fastest possible trial time (2.75 s) while the upper dotted line indicates the trial timeout value (15 s). For Low cues (which required left hand motor imagery), mean latency was statistically significantly longer by 1.04 s with vibratory stimulus on the left arm (p = 0.046). For High cues (which required right hand motor imagery), mean latency was again statistically significantly longer by 0.92 s with vibratory stimulus on the left arm (p = 0.033).