
Figure 6.
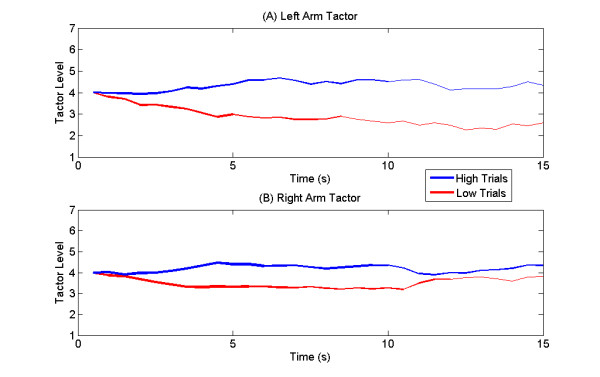
Trajectory Comparison. Mean trajectory plot for all subjects with A) tactor placed on left arm, and B) tactor placed on right arm. The mean trajectory of High trials (which required right hand motor imagery) is shown in blue while the mean trajectory of Low trials (which required left hand motor imagery) is shown in red. The thickness of the line is proportional to the number of trials. Faster divergence and clearer separation is evident between Low and High trajectories when tactor is on the left arm.