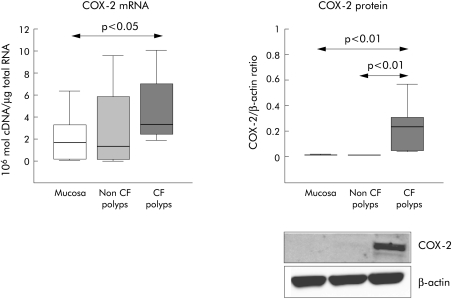
Figure 2 RT‐PCR (106 cDNA molecules/μg total RNA) and Western blot analysis (densitometric ratio between protein and β‐actin) of COX‐2 in CF nasal polyps, non‐CF nasal polyps, and nasal mucosa. Box plots show the 25th, 50th (median), and 75th percentile values. Whiskers show the minimum and maximum values. CF, cystic fibrosis.

An official website of the United States government
Here's how you know
Official websites use .gov
A
.gov website belongs to an official
government organization in the United States.
Secure .gov websites use HTTPS
A lock (
) or https:// means you've safely
connected to the .gov website. Share sensitive
information only on official, secure websites.
