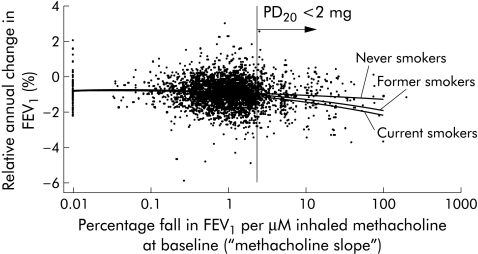
Figure 2 Relative annual change in FEV1 (expressed as percentage of baseline) and responsiveness to methacholine in 1991. The scatter plot shows the unadjusted relative annual change in FEV1 in participants who underwent a bronchial challenge at baseline and spirometric tests at both surveys. The line plot shows the mean annual change in FEV1 by methacholine slope adjusted for FEV1 at baseline, sex, height, pack years, exposure to environmental tobacco smoke, area, weight change, and occupation exposure to dust and fumes by smoking status at SAPALDIA 2. The vertical line indicates the PD20 at 2 mg methacholine and thus separates participants with and without bronchial hyperresponsiveness to methacholine.

An official website of the United States government
Here's how you know
Official websites use .gov
A
.gov website belongs to an official
government organization in the United States.
Secure .gov websites use HTTPS
A lock (
) or https:// means you've safely
connected to the .gov website. Share sensitive
information only on official, secure websites.
