Figure 1.
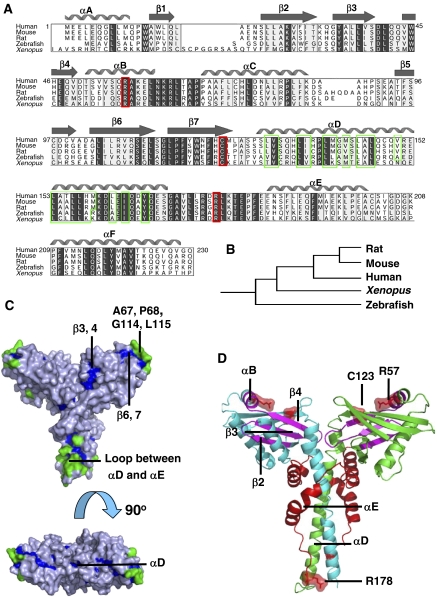
Evolutionary analysis of XLF. (A) Multiple sequence alignment of XLF orthologues. Strongly conserved residues are highlighted in light grey, identical residues are in dark grey, hydrophobic residues in αD are in green frames, the reported human disease mutation sites are in red frames and secondary structure elements of human XLF are shown above the alignment. (B) Clustering of XLF orthologues generated by Evolutionary Trace Server (TraceSuite II) (Innis et al, 2000). (C) Evolutionarily conserved residues mapped onto XLF homodimer structure. Residues conserved but inaccessible to solvent are shown in blue, while those conserved and exposed to solvent are green. (D) Mapping onto XLF structure of the cancer-related mutations found in clinical cases. XLF homodimer is coloured by chain in green and cyan. Disease single-point mutation sites R57 and C123; the mutation of the polypeptide after R178 is indicated in red on both chains. Regions spanning from A25, β2 to R57, αB are magenta.

