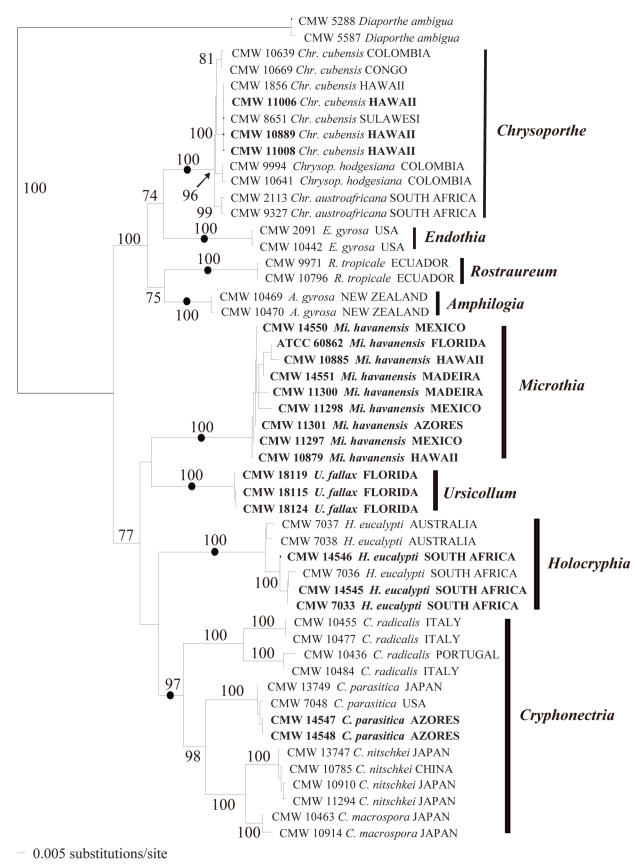
Fig. 2.
A phylogenetic tree obtained with distance analyses (TrN+G+I model, G = 0.9717, I = 0.4643, base frequencies 0.1903, 0.3411, 0.2301, 0.2385; rate matrix 1, 3.1147, 1, 1, 4.1643, 1) from a combined DNA sequences dataset of the ITS1, 5.8S rRNA gene and ITS2 regions of the ribosomal operon, and β-tubulin genes. Bootstrap confidence levels (> 70 %) are indicated on the branches, and those branches representing genera are marked with a dot. The outgroup taxon is Diaporthe ambigua.

