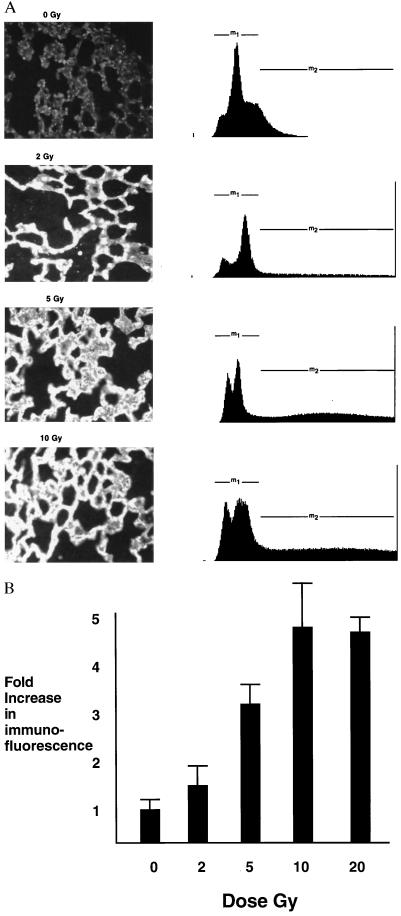
Figure 2.
(A) Anti-ICAM-1 immunofluorescence staining in the irradiated lung. C3H mice were treated with the indicated doses of thoracic irradiation (0, 2, 5, and 10 Gy) and lungs were sectioned at 24 h after irradiation. Sections were incubated with biotinylated antibody followed by avidin-Cy3 fluorochrome. Fluorescence was imaged by UV microscopy and NIH image software. The intensity of fluorescence was then measured for each pixel and graphed as number of pixels at each level of brightness. (B) Bar graph showing the mean and SEM of the fold-increase in anti-ICAM-1 immuno-fluorescence staining in the irradiated lung following the indicated doses.

