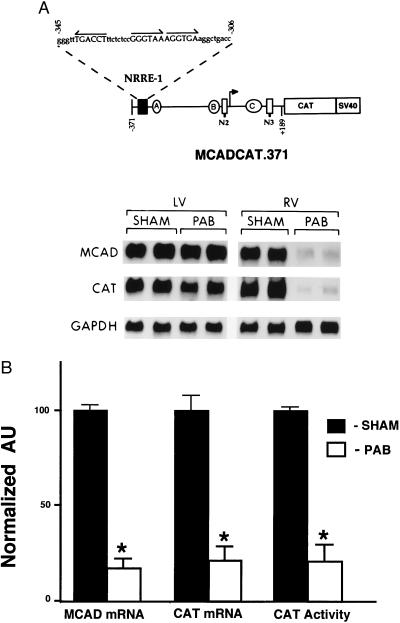
Figure 2.
Expression of the MCADCAT.371 transgene is repressed in the hypertrophied RV. (A) The Northern blot autoradiogram is representative of the results of PAB experiments performed on mice transgenic for the MCAD promoter-CAT reporter construct MCADCAT.371 (shown schematically at the top). MCADCAT.371 includes a human MCAD gene promoter fragment (horizontal line) containing 371 bp upstream to 189 bp downstream of the transcription start site (arrow) fused to a bacterial CAT gene-simian virus 40 intron-polyadenylylation signal sequence. The positions of the three known transcriptional regulatory units in the MCAD gene promoter are represented. Each unit is composed of a NRRE (NRRE-1, N2, or N3) and a GC-rich box (A, B, or C). The sequence of potential nuclear receptor binding sites (arrows) within NRRE-1 is also shown. The Northern blot was obtained with total RNA isolated from LV and RV tissue of PAB or sham-operated control (SHAM) MCADCAT.371 mice. The blot was sequentially hybridized with cDNA probes encoding mouse MCAD, bacterial CAT, and human GAPDH. (B) Expression of the MCADCAT.371 transgene (CAT mRNA and enzymatic activity) and endogenous mouse MCAD gene (MCAD mRNA) in RV of PAB or sham-operated controls. mRNA values represent mean (± SEM) levels as determined by densitometric analysis of RNA blots obtained with total RNA from eight PAB and 10 control MCADCAT.371 mice from two independent transgenic lines [lines 10–1 (transgene copy number = 55) and 10–4 (transgene copy number = 14) described in ref. 26]. All values are shown relative to mean control values set arbitrarily at 100. Mean RV CAT enzymatic activities (normalized to mean control levels = 100) are also shown. ∗ denotes a statistically significant difference (P < 0.05) compared with controls.

