
Figure 2.
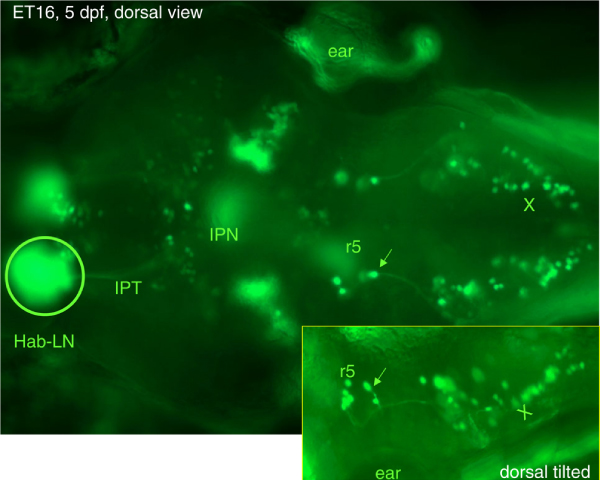
As living markers ET lines provide a possibility to analyze developmental events in vertebrates at single-cell resolution. Shown is expression of green fluorescent protein in a 5 days postfertilization ET16 larvae with an insertion of Tol2 into the 3'-untranslated region of inversin. The arrow shows a projection from r5 to the vagal nucleus. Hab-LN, lateral nucleus of habenula; IPN, interpeduncular nucleus; IPT, interpeduncular tract; r5, rhombomere 5; X, vagal nucleus.