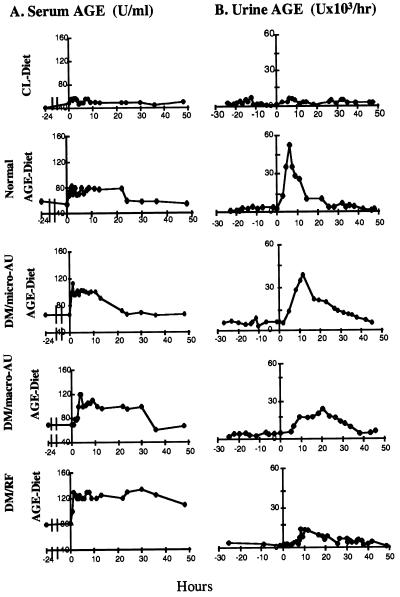
Figure 2.
Diet-induced AGE kinetics in human serum (A) and in urine (B) following a single meal of AGE- or CL-diet. Each curve is representative of the profiles obtained from groups of either normal subjects or diabetic patients with renal disease [DM/micro-AU, DM/macro-AU or DM/renal failure (RF)] and are based on ELISA. Serum values are expressed as AGE units/ml and urinary data as AGE units × 103/hr.

