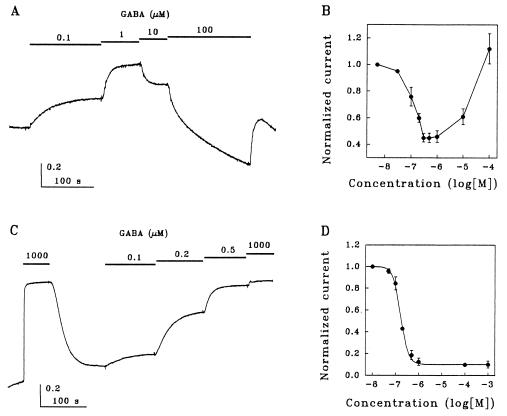
Figure 4.
Responses of M2 domain mutant receptors ρ1(L317A) and ρ1(T314A/L317A) to GABA. (A) Typical responses of mutant ρ1(L317A) receptors to GABA. (B) GABA dose-response relationship for ρ1(L317A) receptors. Measurements were made when the effect of GABA had reached a plateau (steady-state). Data points represent mean ± SD (n ≥ 5 oocytes in each case). (C) Typical responses of mutant ρ1(T314A/L317A) receptors to GABA. (D) GABA dose-inhibition relationship for ρ1(T314A/L317A) receptors. Data points represent mean ± SD (n ≥ 5 oocytes). The line is the fit to the Hill equation with IC50 = 0.17 μM and nH = 2.7. Traces in A and C are normalized to the amplitude of the initial spontaneous current, and the ordinate values represent arbitrary units.

