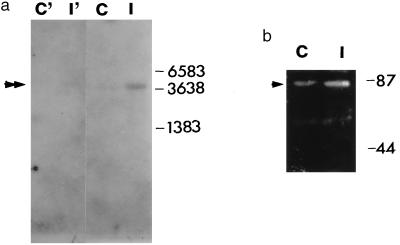
Figure 4.
Northern (a) and Western (b) blotting analysis of the ischemia-induced COX-2 expression in the ischemic (I) and contralateral (C) cortex. (a) The Northern blot shows a 4.1 kb-band (double arrowhead) that is barely detectable in the control sample but clearly seen in ischemic tissue. In MK-801-pretreated brain the signal is very low both in contralateral (C′) and ischemic (I′) tissue. In the Western blot (b) an arrowhead points to a 70-kDa COX-2-immunoreactive band.

