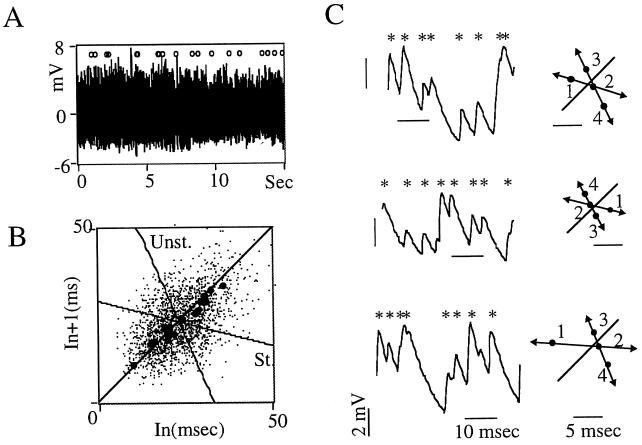
Figure 3.
UPOs in third order PMs. (A) A 15-sec segment of synaptic noise (digitized at 3 kHz) displayed at a slow sweep speed with the location of UPOs (n = 20) indicated by ○. (B) Return plot showing the centers of the UPOs (•) signaled in A, and the mean of their stable (St.) and unstable (Unst.) directions. Note that most centers are clustered, suggesting multiple approaches to the same fixed point, as expected from candidate UPOs. (C) Examples of synaptic events (asterisks) selected with a value of T3 similar to that in Fig. 2B (Left), and reconstruction of the UPOs that they generate (Right). The numbered dots indicate the corresponding interevent intervals and delineate almost parallel stable (arrows 1 and 2) and unstable directions (arrows 2–4). Statistical tests indicated K values of 3.7, 2.82, and 2.72 for random, Gaussian scaled, and Fourier shuffle surrogates, respectively. A, B, and C are from the same experiment.

