Figure 4.
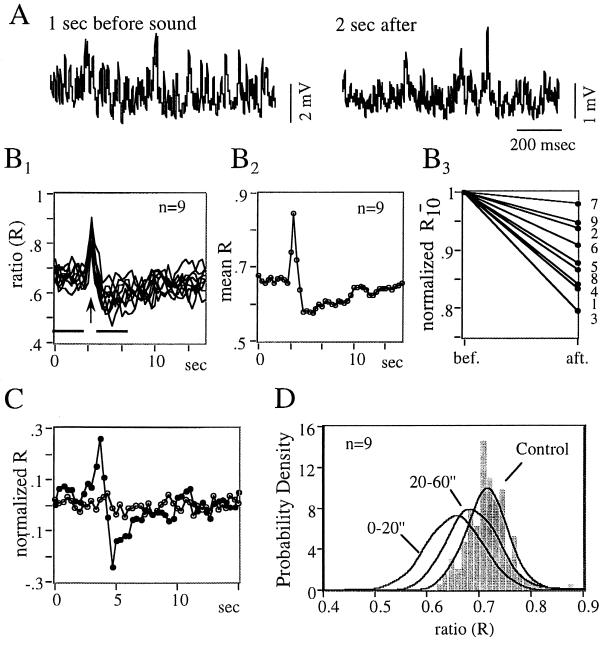
Modifications of dynamics by sensory stimuli. All data are from the same experiment. (A) Segments of synaptic noise (sampling rate 1.5 kHz) recorded before (Left) and 2 sec after (Right) a tone. Note the decrease in signal amplitude, despite similar membrane potential (not shown). (B1–B3) Variations of the ratio, R, after sounds (B1). Superimposed plots of the R values versus time in a series of nine consecutive stimulations (arrow) repeated every minute. Each trace was constructed using 46 windows (RPs) of 1 sec, overlapping each other by 2/3 of a second, embedding dimension = 5, lag = 33 msec, and cutoff chosen so that = 2.5%Ne2 ± 1,000 dots (this constant value compensates for changes in signal amplitude). (B2) Mean biphasic change of R. (B3) Diagrams of normalized ratios of 10 epochs (R10, ordinate) before (bef.) and after (aft.) sounds, at times signaled by horizontal bars in B1. Numbers on the right indicate the order of stimulus presentations. (C) Plots obtained in one trial, of R versus time (•) and of its mean derived from surrogates (○, n = 50 per point). (D) Persistence of R modifications. Probability density function of R values obtained from consecutive windows of 1 sec each, for n = 160 sec of control period, 20 sec and 40 sec after each sound (nonoverlapping, same parameters as for B1). The probability density functions were estimated with a classical histogram (shown for the control) and with more accurate nonparametric methods known as Parzen estimators (thick lines) (26). Kolmogorov Smirnov tests ruled out that the three histograms originated from the same distribution (Qks < 10−5).

