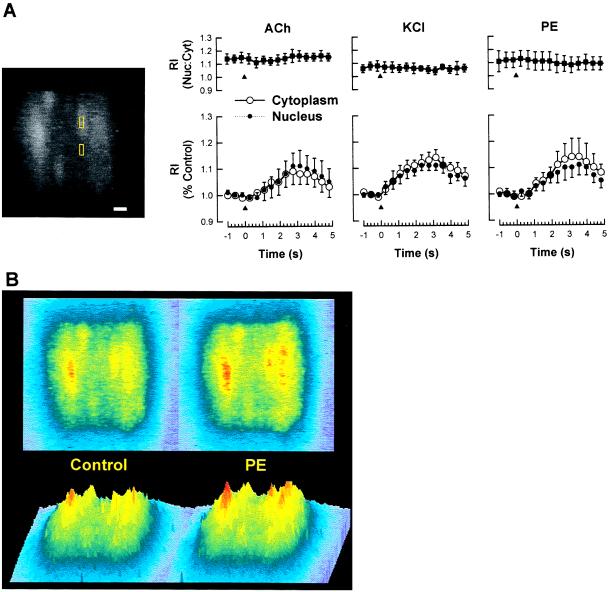
Figure 3.
Image analysis of arteriolar endothelial cell [Ca2+]i responses to agonists. In these experiments the plane of focus was lowered to the layer of endothelial cells lining the bottom surface of the arteriole (hence no diameter responses were obtained). (A) Analysis of recorded video images allowed determination of nuclear and cytosolic changes in fluorescence intensity. (Left) Endothelial cells are orientated longitudinally along the arteriole (top to bottom) and are readily distinguished from smooth muscle cells (not visible). Small boxes were positioned in the two compartments (three cells per image) and relative intensity (RI) over time was recorded. Note: In all experiments only a short segment of arteriole was exposed to epi-illumination. (Bar = 10 μm.) (Right) Each agonist increased both nuclear (Nuc) and cytosolic (Cyt) fluorescence intensity in equal proportions. ACh (n = 6), PE (n = 4), and KCl (n = 4) were applied at the same concentration and for the same duration as described in Fig. 1. After a response to ACh was obtained, PE and/or KCl was applied at the same arteriolar location. Values are means ± SE; ▴ denotes time at which agonist application commenced. (B) Pseudocolor images of arteriolar endothelial cells before (Control) and 1 sec after (PE) stimulation with 10−4 M PE. Bottom panels are profiles of the corresponding top panel images.

