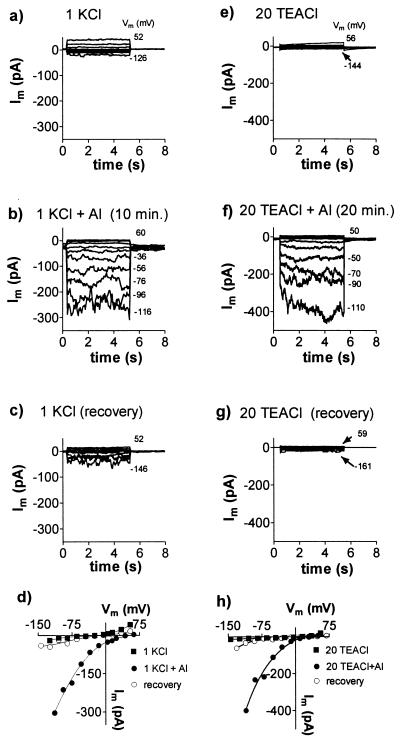
Figure 1.
Activation of an inward current in whole cells by AlCl3. Results are shown from two experiments which included either KCl (a–d) or TEACl (e–h) in the solutions. Whole-cell currents, Im, were recorded as Vm was stepped from a holding potential near 0 mV in 20-mV intervals to the levels shown (to the right of the current traces). Plots a–c and e–g represent a sequence of solution changes. The control solution shown in a comprised 1 mM KCl and 0.2 mM CaCl2, pH 4.0. The control solution shown in e contained 20 mM TEACl and 0.2 mM CaCl2, pH 4.0. Similar solutions containing 50 μM AlCl3 were added in b and f, and the currents were recorded after the time indicated. AlCl3 was then removed by changing to the control solution again as shown in c and g. Currents measured at the end of the voltage pulses were used to construct the current–voltage curves shown in d and h. The pipette solution for a–d was (mM) 90 KCl, 7.6 CaCl2, 10 EGTA, 10 Hepes, and 48 KOH to pH 7.2. The pipette solution for e–h was (mM) 100 TEACl, 2 MgCl2, 10 Hepes, 2 EGTA, 2 Na2ATP, and 20 TEAOH to pH 7.2.

