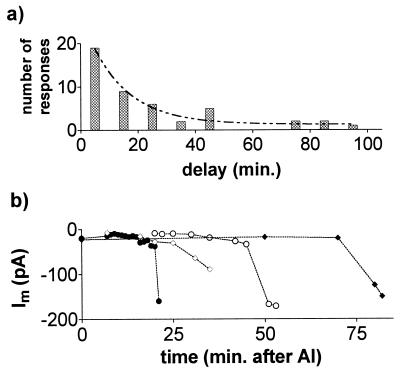
Figure 2.
Time-dependent activation of whole-cell currents by Al3+. (a) Frequency histogram showing the time required, after addition of Al3+, to activate the inward current. Columns indicate activation occurring between 0 and 10 min or between 11 and 20 min, etc. Data are fitted with an exponential curve. (b) Time-dependent increase of inward currents measured at −90 mV after addition of Al3+. Results from four different experiments are shown.

