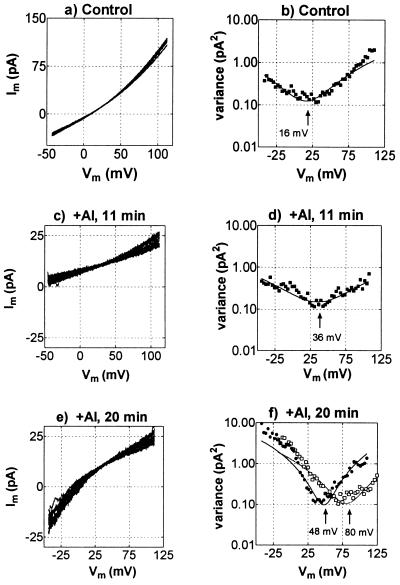
Figure 4.
Current–voltage curves and variance–voltage curves derived from voltage ramps in the whole-cell configuration before and after addition of 50 μM AlCl3. For each treatment 15 sequential ramps, lasting 250 ms each, were applied between about −45 and 110 mV (2-kHz sampling, 0.5-kHz, four-pole Bessel filter). These are shown superimposed in each of a, c, and e. To the right of each current–voltage curve in b, d, and f is shown the variance–voltage curve, and the minima were obtained by fitting quadratic functions to the data. f also shows the variance–voltage curve when TEACl was reduced from 20 mM to 2 mM (□ and dotted line). Pipette solution (mM): 100 TEACl, 2 EGTA, 10 Hepes, 7 TEAOH to pH 7.2. The bath solution consisted of (mM) 20 TEACl, 0.2 CaCl2, pH 4.

