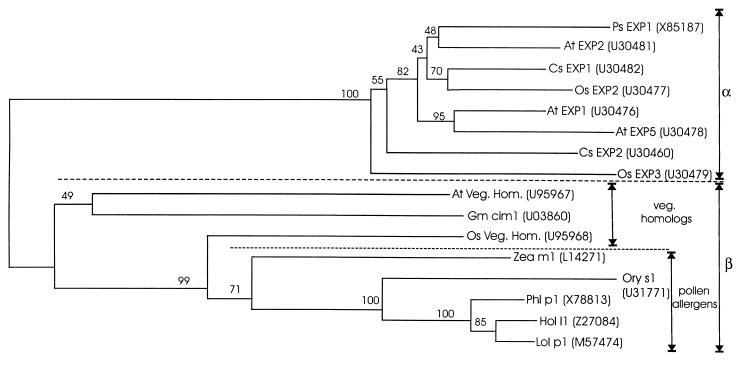
Figure 4.
Phylogenetic tree of α-expansins, group I allergens, and their vegetative homologs. Protein sequences were aligned using the clustal program with PAM250 weight table and the tree was constructed by bootstrap analysis (1,000 replications) using nearest neighboring joining of the Poisson-corrected values for amino acid differences, using the mega phylogenetic analysis program (S. Kumar, K. Tamura, and M. Nei, Institute for Molecular Evolutionary Genetics, Pennsylvania State University). The numbers on the tree indicate the bootstrap P values. GenBank accession numbers are also indicated for each sequence.

