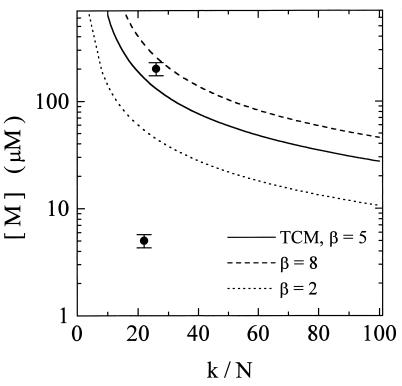
Figure 3.
Predictions using the TCM (solid line) for the minimal agent concentration needed to give satisfactory image contrast for the Xenopus microinjection imaging experiments. In this situation Eq. 14 applies, with [M]a = [M], [M]b = 0, and Ra = Rb = R. For a given k/N, cells labeled with concentrations falling on or above the curve are easily distinguished from unlabeled cells; concentrations well below the curve should not be detected. The TCM assumes a contrast-to-noise ratio, β, equal to 5 (Fig. 1). Other values of β are also shown (β = 2, dotted line; β = 8, dashed line). The points at 5 and 200 μM correspond to the agent concentrations in the labeled cells used in the imaging experiments. These results are displayed in Fig. 4. In Fig. 3, we emphasize that the data points only map the experimental conditions onto the theoretical curve and are not used for fitting the model. In calculating Fig. 3, we have used R = 4.1 ± 0.1 mM−1⋅s−1, which is the relaxivity of GdHP-DO3A measured at 500 MHz, and T01 = 1.3 ± 0.2 s, which is the T1 of unlabeled cells in the blastocoel roof. All measurements were performed at 15°C.

