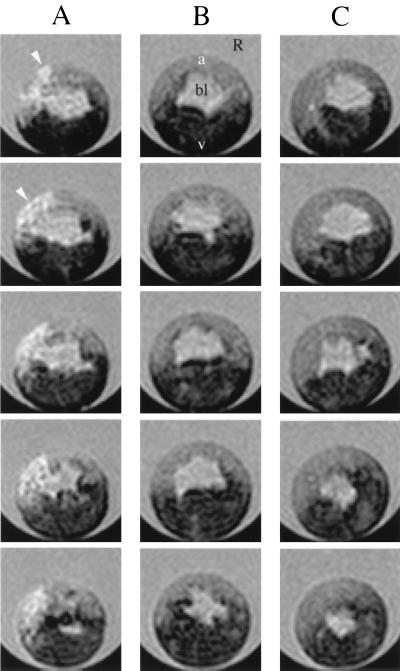
Figure 4.
Slices through 3D in vivo μMR images of Xenopus embryos labeled with calibrated microinjections of various concentrations of GdHP-DO3A into single blastomeres. A single blastomeres in the animal cap at stage 4 (8 cells) was injected, and the final agent concentration in blastomere after dilution was estimated to be 200 μM in A and 5 μM in B. A control or uninjected embryo is shown in C. The embryos were imaged while they developed through approximately stages 7 to 10. Regions common to all these embryos have been indicated in the top panel of B: the blastocoel (bl), animal region (a), vegetal region (v), and regions (R) containing the Ringer solution, which is surrounding the embryos in the quartz tube. In A, the labeled cells are clearly visible in the animal cap region (arrows) and appear hyperintense. In B, no detectable contrast enhancement is observed compared with the control (C) (matching the predictions of Fig. 3). The vegetal region, which contains yolk, is darker in the image presumably because of a small amount of T2-weighting. A 3D SE pulse sequence was used to acquire images at 50-μm isotropic resolution. The data were zero-filled before Fourier transformation, yielding a final isotropic resolution of 25 μm. Single 25-μm slices are displayed in each panel, and slices in contiguous panels are separated by 100 μm. For all images, two scans per phase encoding step were averaged, and TE = 10.2 ms. The TR values were calculated by using Eq. 4 for each concentration; TR values equal to 1.28 and 0.885 s were used for the 5 and 200 μM embryos, respectively. The images were acquired at 15°C.

