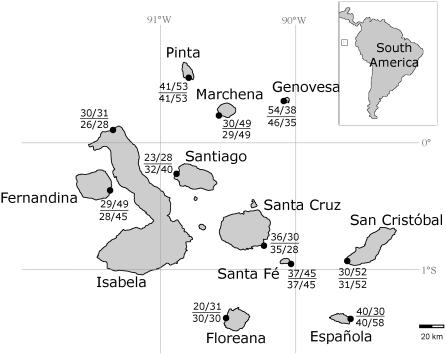
Figure 1. Map of the Galápagos archipelago in relation to South America and the Equatorial line (inlet).
Localities are shown for the eleven islands sampled in 1991/1993 and 2004. For each population, sample sizes are labelled as follows: above the line are the number of individuals analyzed for 13 microsatellite loci from the 1991/1993 and 2004 samplings respectively; below the line are sample sizes used in mtDNA control region analysis from the 1991/1993 and 2004 samplings respectively.

