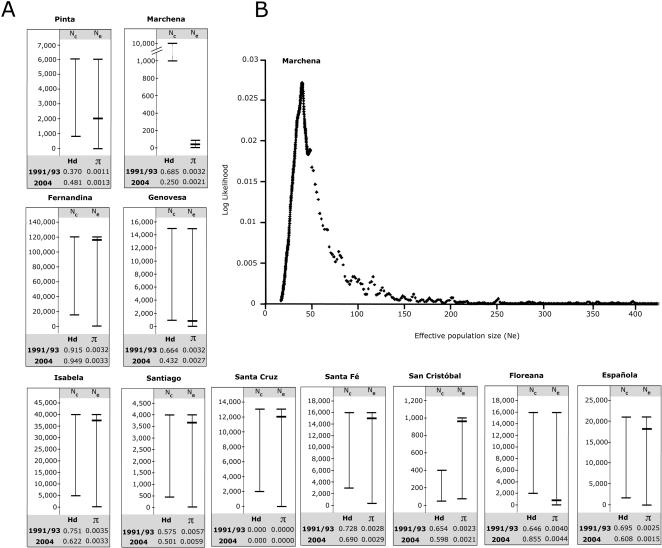
Figure 2. Illustration of estimated effective population size (Ne) for Galápagos marine iguana populations.
(A) Bar graphs showing the harmonic mean of the estimated effective population size (Ne) for 11 marine iguana populations based on temporal variance of allele frequencies for 13 microsatellite loci between 1991/1993 and 2004. Nc represents the census size range (with min. and max. lines) for each island population compiled from multiple field surveys [14]. The estimated harmonic mean of Ne is represented by a single, bold, horizontal line within the broader 95% confidence interval (CI) of the respective estimate. MtDNA haplotype (Hd) and nucleotide (π) diversity values for each population are shown for both the 1991/1993 and 2004 samplings. Note: for all populations except Marchena, the estimated 95% CI of Ne overlaps with the maximum estimate of Nc. (B) Graphical display of the mean estimated Ne indicative of the genetic bottleneck detected for marine iguanas on Marchena between 1993 and 2004. Ne (x-axis) between 1993 and 2004 was estimated at 40 individuals (95% CI = 21–86 individuals) and is indicated by the peak of the log likelihood value (y-axis) at Ne = 40. Please see Figure S1 for graphical displays of Ne estimates for other populations and Materials and Methods for the approach to estimate Ne.

