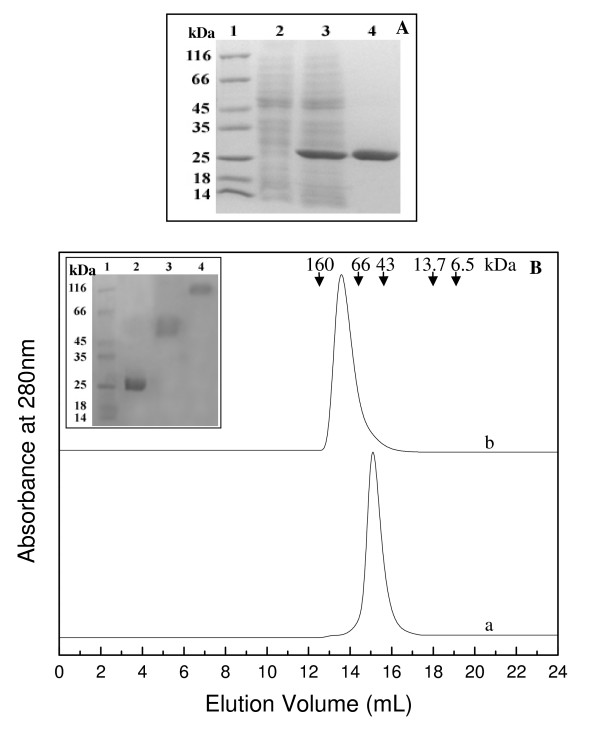
Figure 1.
Overexpression of PfGST in E. coli and purification of the recombinant protein over Ni-NTA agarose. A. SDS-PAGE analysis of cell lysate showing overexpression of PfGST and the purified protein. Lanes 1–4 represent molecular weight markers, supernatant of un-induced culture lysate, supernatant of induced culture lysate and purified protein, respectively. B. Molecular weight andsubunit structure of PfGST dimer and tetramer. SEC profileof (a) dimeric PfGST; obtained by incubation of protein with 2 mM GSH and run with buffer containing 2 mM GSH and (b) tetrameric PfGST; incubated and run with buffer not containing GSH on a Superdex™ 200 10/300 GL column at pH 8.0 and 25°C. The column was calibrated with standard molecular weight markers: Glucose oxidase (160 kDa), albumin (66 kDa), ovalbumin (43 kDa), ribonuclease A (13.7 kDa) and aprotinin (6.5 kDa). The curves have been displaced on Y-axis for presentation. Inset shows the SDS-PAGE profile of glutaraldehyde cross-linked PfGST protein samples. Lanes 1–4 represent molecular weight markers, uncross-linked native PfGST, glutaraldehyde cross-linked dimeric PfGST and tetrameric PfGST protein samples, respectively.

