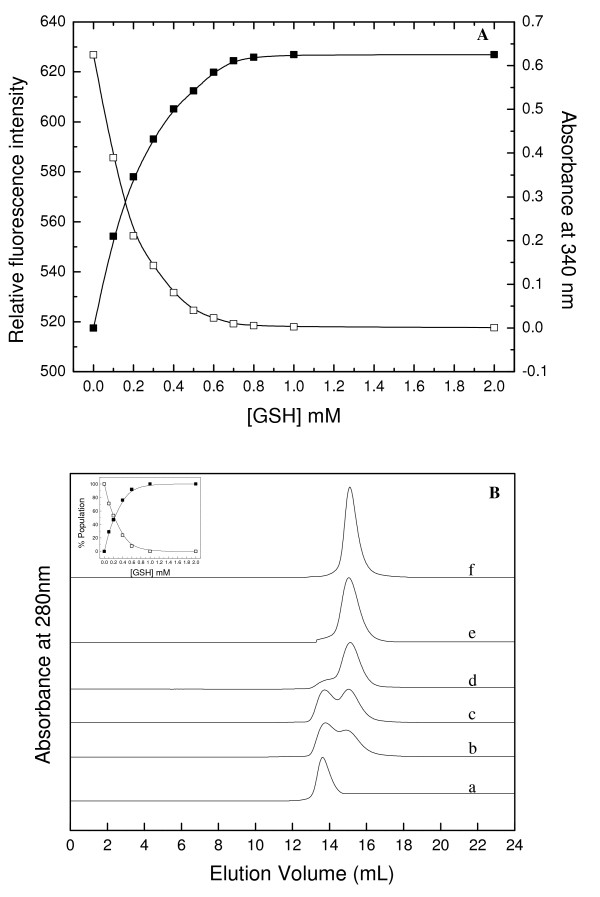
Figure 2.
Effect of GSH on oligomeric status and enzymatic activity of PfGST. A. Quenching of tryptophan fluorescenceintensity and enzymatic activity of tetrameric PfGST withincreasing concentrations of GSH. In the figure, solid and hollow squares denote data for enzymatic activity and fluorescence, respectively. B. SEC profile of tetrameric PfGST incubated with increasing concentrations of GSH for 2 h at 25°C and run in the same GSH containing buffer. In the figure, a-f represent curves for tetrameric PfGST incubated with 0, 0.1, 0.2, 0.4, 0.6 and 2.0 mM GSH, respectively. The curves have been displaced on Y-axis for presentation. Inset shows the percent population of dimeric (solid squares) and tetrameric (hollow squares) species of PfGST with increasing concentration of GSH based on the data obtained from the curves displayed in the main figure.

