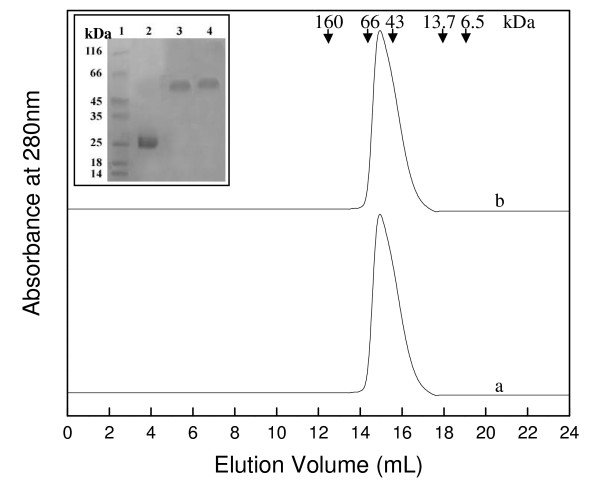
Figure 3.
Effect of GSH on oligomeric status of human GST. SEC profile of human GST. Curve "a" represent hGST incubated and run with buffer containing 2 mM GSH, while curve "b" represent hGST incubated and run with buffer not containing GSH. The curves have been displaced on Y-axis for presentation. Inset shows the SDS-PAGE profile of glutaraldehyde cross-linked hGST protein samples. Lanes 1–4 represent molecular weight markers, uncross-linked native hGST, glutaraldehyde cross-linked hGST incubated with GSH and hGST incubated without GSH protein samples, respectively.

