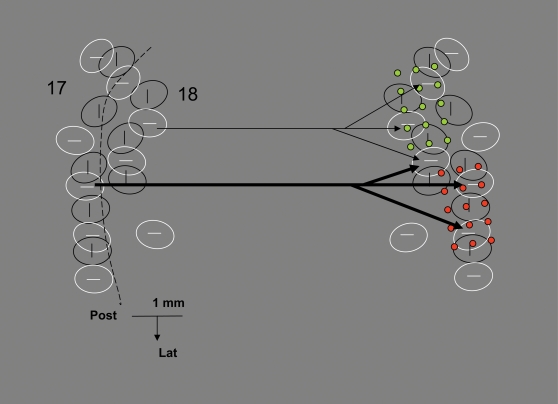
Figure 11. A model of interhemispheric interactions via callosal axons.
The figure shows surface views of two sets of orientation columns (vertical and horizontal) in each hemisphere, redrawn and schematized from an optical imaging experiment in the ferret (unpublished). Iso-oriented columns are interconnected as shown by physiological and imaging experiments (text). Two sets of axons of different thickness and hence conduction velocity are shown; each axon diverges to 2–3 columns within a surface of 1 to 1.5 mm2 as shown by the reconstruction of single axons in the cat ([15] and Fig. 1). Each axon activates its targets synchronously but differences in conduction velocity among axons cause asynchronous activations of targets reached by the two axons. The model implies a partial spatial separation in the termination of axons of different conduction velocity such that mainly synchronizing effects of contralateral input would be observed at the two electrode arrays positions shown (green and red dots; drawn to scale) while mainly desynchronizing effects would be observed at intermediate locations sampling from the terminations of different conduction velocity axons. A segregation of callosal axons with different conduction velocity was indeed observed in the cat [15]. Which target neurons are contacted by callosal afferents is only partially known. Thalamo-cortical neurons, local inhibitory interneurons as well as, probably, callosally projecting and other cortico-cortical projecting neurons receive callosal input [3], [29], [35], [36].

