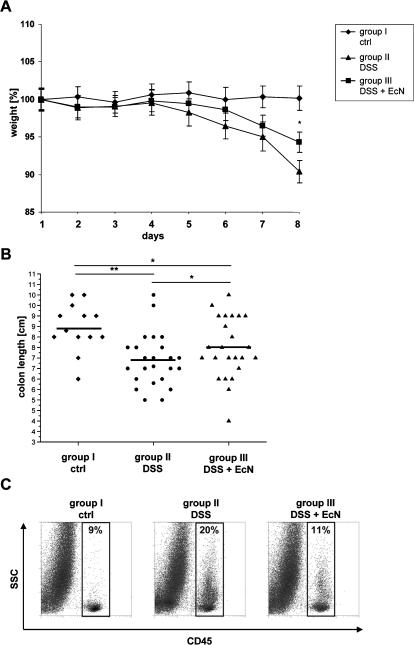
Figure 4. Administration of EcN in DSS induced colitis.
(A) Disease severity was measured daily and is expressed in terms of body weight loss. (group II: n = 23, group III: n = 25, group I: n = 17) *p<0.05 group III vs. group II. (B) Reduction of colon length. Measurement of colon length [cm] after preparation. (group II: n = 24, group III: n = 25, group I: n = 13) *p<0.05 group III vs. group II or group III vs. group I **p<0.01 group II vs. group I. (C) Infiltration of hematopoietic cells into the colon. Whole intestinal cell populations were labeled with anti-CD45 APC antibody and measured by FACS analysis (n = 6/group).

