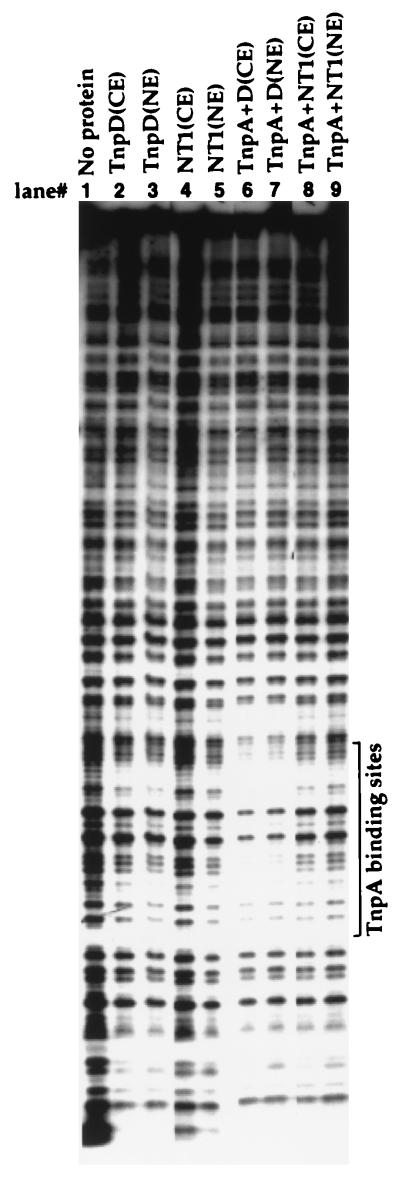
Figure 6.
DNase I footprint analysis of protein–DNA complexes. A labeled DNA fragment containing a tail-to-tail dimeric TnpA binding motif was incubated with the proteins indicated at the top of each lane before digestion with DNase I. The digested products were fractionated on a denaturing 8% polyacrylamide gel. TnpD (CE) and TnpD(NE) were whole cell and nuclear extracts, respectively, of transgenic tobacco cells expressing TnpD from CaMV 35S promoter; NT1(CE) and NT1(NE) were whole cell and nuclear extracts, respectively, of untransformed tobacco cells. The position of TnpA binding sites was determined by Maxam–Gilbert sequencing of the labeled DNA.

