Figure 1.

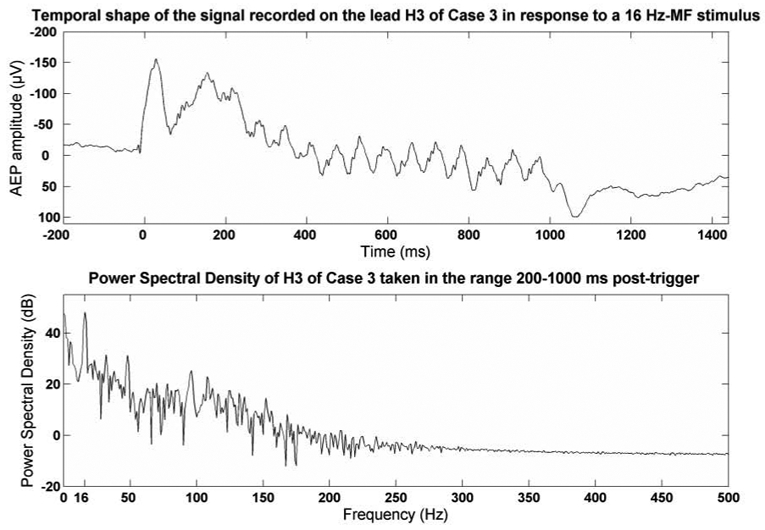
Above: Shape of the AEP recorded on lead H3 of Case 3 in response to a 16 Hz-MF stimulus. Below: Power spectral density of H3 taken in the range 200–1000 ms post-trigger.

Above: Shape of the AEP recorded on lead H3 of Case 3 in response to a 16 Hz-MF stimulus. Below: Power spectral density of H3 taken in the range 200–1000 ms post-trigger.