Figure 4.


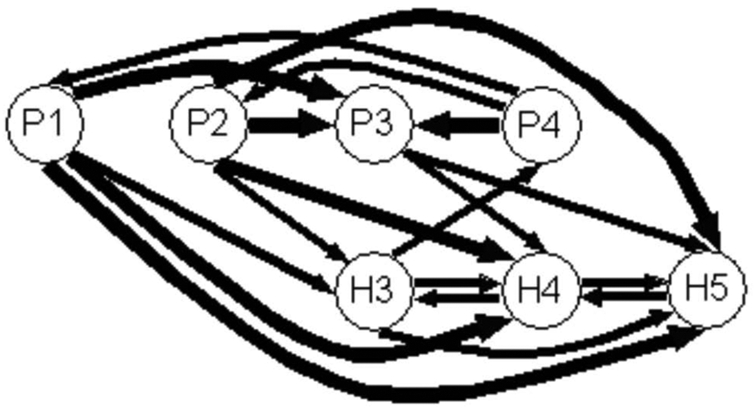
Figure 4a. Graph of propagation between the leads of electrode P and of electrode H located in the PAC, at the frequency MF = 8 Hz for Case 3. The arrow width codes interaction strength (0 ≤ no arrow ≤ 0.6 < increasing width solid lines in step of 0.2). The most medial lead is the first one and the most lateral is the fifth.
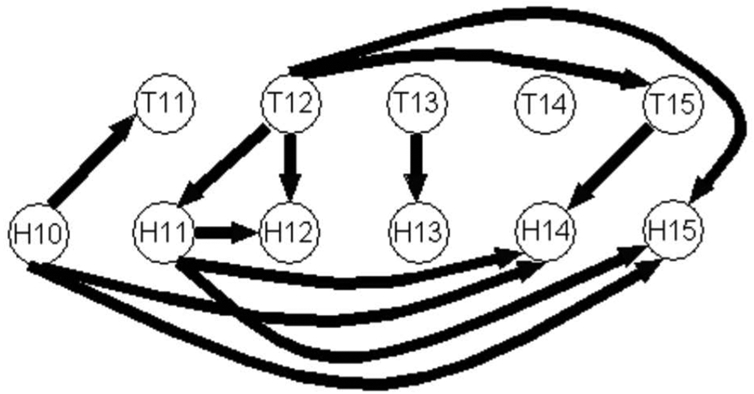
Figure 4b. Graph of propagation between the leads of electrode T and of electrode H located in the PAC, at the frequency MF = 8 Hz for Case 20. The arrow width codes interaction strength (0 ≤ no arrow ≤ 0.8 < increasing width solid lines in step of 0.2).
