Figure 6.


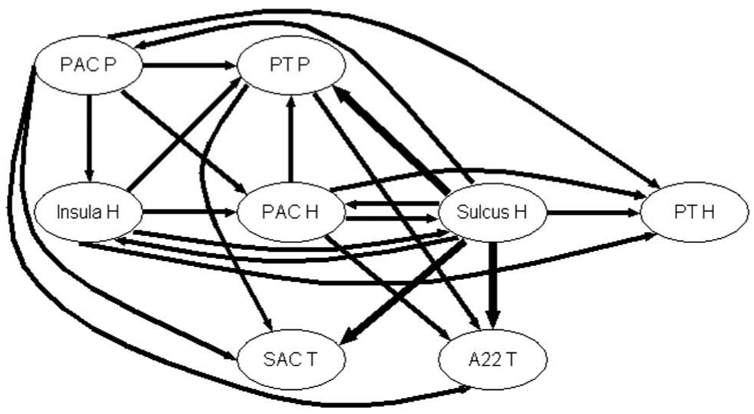
Figure 6a. Graph of propagation between the 8 sub-regions of Case 3 at the frequency MF = 8 Hz. The arrow width codes interaction strength (0 ≤ no arrow ≤ 0.6 < increasing width solid lines in step of 0.2).
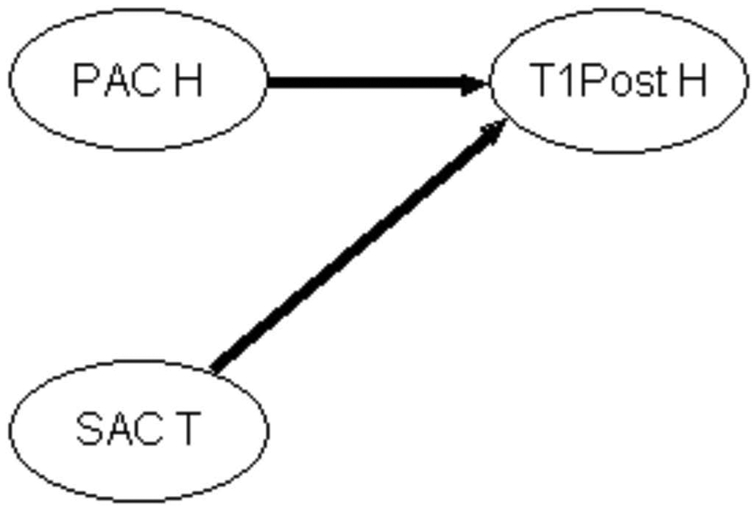
Figure 6b. Graph of propagation between the 3 auditory sub-regions of Case 1 at the frequency MF = 8 Hz. The arrow width codes interaction strength (0 ≤ no arrow ≤ 0.6 < increasing width solid lines in step of 0.2).
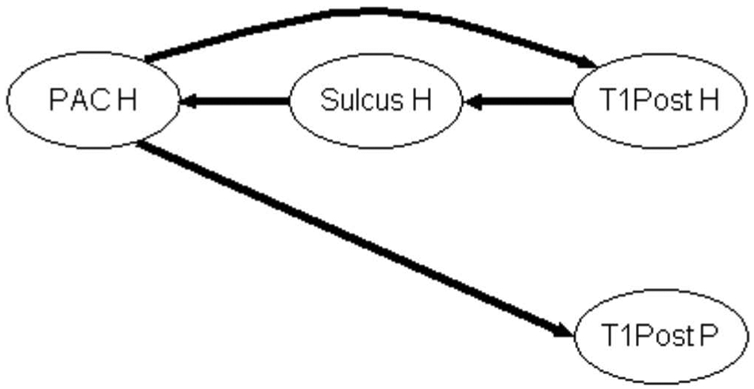
Figure 6c. Graph of propagation between the 4 auditory sub-regions of Case 12 at the frequency MF = 8 Hz. The arrow width codes interaction strength (0 ≤ no arrow ≤ 0.6 < increasing width solid lines in step of 0.2).
