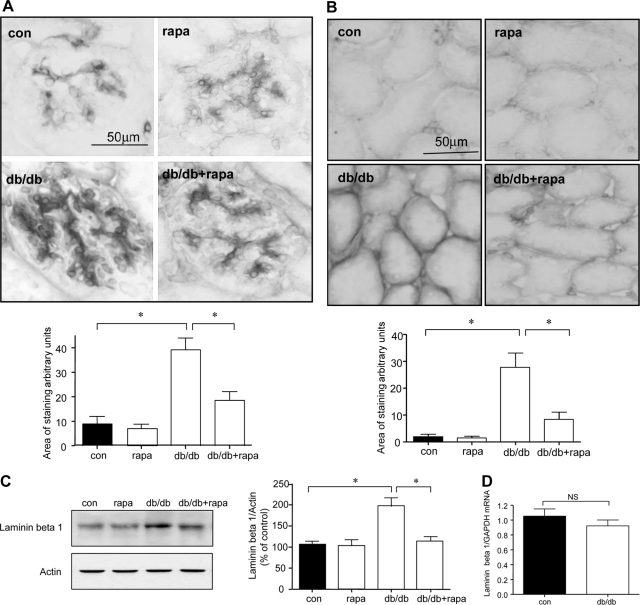
Figure 8.
Rapamycin inhibits laminin-β1 accumulation in diabetic mice. A and B: Expression of laminin-β1 in glomeruli (A) and tubules (B) was assessed by immunoperoxidase histochemistry in all of the four groups. Representative micrographs from six mice in each of the four groups are shown. Composite mean ± SE data from six mice in each group are shown in a histogram (*P < 0.001 db/db versus control, db/db versus db/db + rapa). C: Equal amounts of renal cortical lysates were immunoblotted with an antibody against laminin-β1; loading was assessed by immunoblotting for actin as shown in the bottom panel. Each lane represents data from a single animal. Composite values from six mice in each group are shown in a histogram (*P < 0.001, db/db versus control; *P < 0.001, db/db versus db/db + rapa). D: Real-time RT-PCR was performed on renal cortical preparations to explore changes in laminin-β1 mRNA; GAPDH was used as a control. Composite mean ± SE data from six mice in each control (con) and diabetic (db/db) groups are shown in a histogram (NS, not significant, control versus db/db by Student’s t-test). Scale bars = 50 μm.

