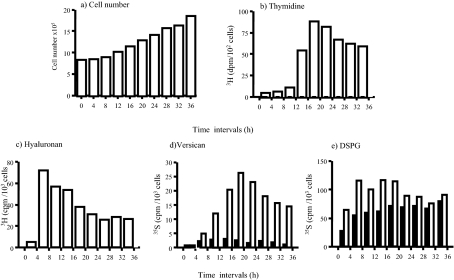
Figure 5.
Kinetics of HA and proteoglycan synthesis. The time course experiments were performed as described in Materials and Methods. a: Cell numbers were determined using the crystal violet staining. b: DNA was determined by the incorporation of 3H thymidine. c: Incorporation of 3H-glucosamine into HA. d: Incorporation of [35S]-sulfate into versican. e: Incorporation of [35S]-sulfate into DSPG. Results are representative of two independent experiments and are expressed as the combined values of cell/matrix-associated and conditioned medium levels of HA and proteoglycans in proliferating (open bars) or nonproliferating (filled bars) cultures. Data shown are for one of two independent experiments that both showed the same patterns of synthesis.

