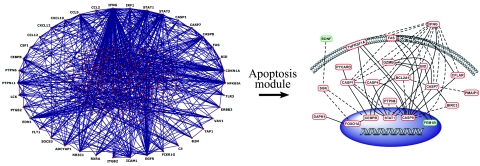
Figure 3.
Interaction network of differentially expressed genes. A gene network based on known gene product interactions was generated using IPA software and displayed using Pajek’s visualization tool (left). Genes that are hubs or nodes of high interconnectivity (≥10) are shown on the outer rim of the network. A complete list of hubs is provided in Supplemental Table 3 (see http://ajp.amjpathol.org). A module within the interactome corresponding to apoptosis-related pathways was amplified and displayed according to subcellular localization of its gene products (right). In the apoptosis module, red ovals are differentially up-regulated and green ovals are differentially down-regulated genes in CM-susceptible (C57BL/6) relative to CM-resistant (BALB/c) mice. The majority of these genes were differentially up-regulated in C57BL/6 mice, demonstrating that there is widespread activation of apoptotic pathways in the brains of CM-susceptible mice.

