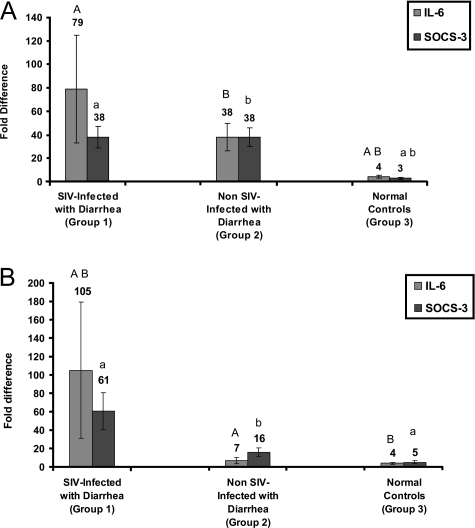
Figure 1.
Relative abundance in gene expression for IL-6 and SOCS-3 detected using quantitative real-time SYBR Green one-step RT-PCR. A and B represent colon and jejunum, respectively, from SIV-infected animals with diarrhea, non-SIV-infected with diarrhea, and uninfected control macaques. The fold differences in gene expression were calculated as described in Materials and Methods. The relative fold increases for each group was summed and averaged to obtain a single figure that is shown on top of each bar graph. The error bars represent average fold difference for each group ± SEM. Bar graphs with same letter and case (eg, A and A) differ significantly (P < 0.05). The upper case letters denoted above gray bars represent IL-6. Similarly, the lower case letters shown above black bars represent SOCS-3.

