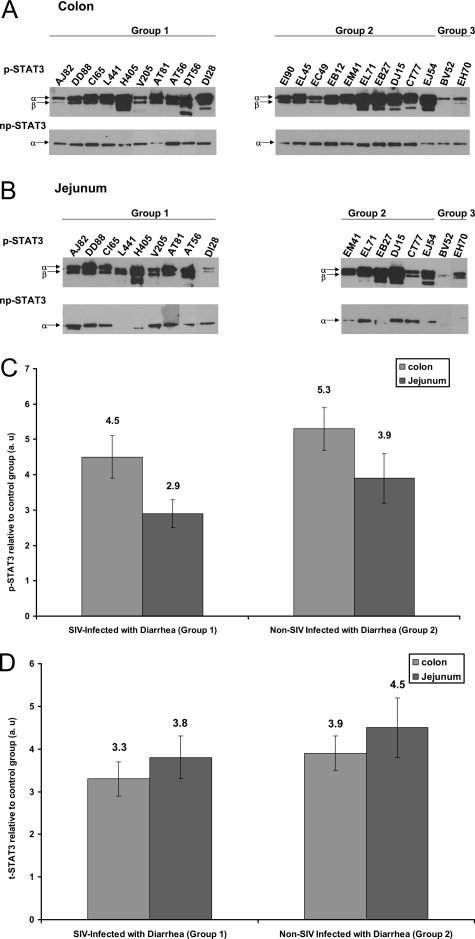
Figure 2.
IL-6-mediated STAT-3 activation at tyrosine 705 occurs in the colon (A) and jejunum (B) of SIV-infected (group 1) and non-SIV-infected macaques (group 2) with diarrhea. p-STAT3 and then np-STAT3 were sequentially immunoprecipitated from the same lysates of colon and jejunum and run on SDS-PAGE, and thereafter, the membrane was probed with appropriate antibodies. Two control macaques (group 3) (BV52 and EH70) were used for the STAT3 Western analysis. Because the tissues were collected throughout a period of 2 years, immunoprecipitation and Western blotting were performed separately as the tissues were obtained. Hence the images shown in A and B were cropped, aligned, and merged into one composite figure. Quantitative densitometric analysis of p-STAT3 and t-STAT3 (p-STAT3 + np-STAT3 = t-STAT3) protein expression are shown in C and D, respectively, for the colon and jejunum of groups 1 and 2 macaques relative to group 3 (control animals). Values are expressed in arbitrary units (a.u.). The relative fold increases for individual animals in both groups was summed and averaged to obtain a single figure that is shown on top of each bar graph. The error bars represent average fold difference for each group ± SEM.

