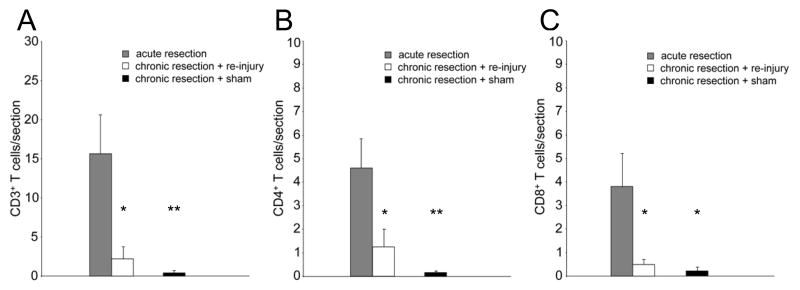
Figure 4.
Quantification of CD3+, CD4+, and CD8+ T cells in the FMN of WT mice. For A and C, each bar represents the S.E.M. of 5 (acute resection) and 6 (chronic resection + re-injury, chronic resection + sham) mice. For B, each bar represents that S.E.M. of 5 (acute resection, chronic resection + re-injury) and 6 (chronic resection + sham) mice. *p<0.05, **p<0.01 (compared to acute resection)

