
Figure 1. Similarities between IFN-related gene lists in the L2L microarray database.
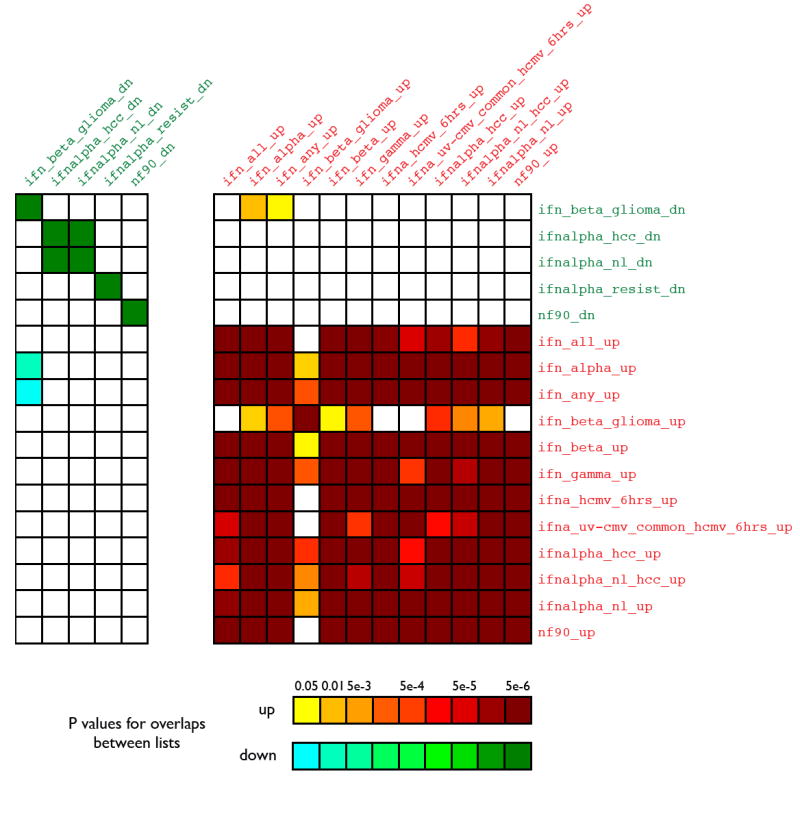
The L2L and LOLA databases include a number of gene lists derived from published studies that investigated the effects of interferons (IFN) on gene expression, using disparate source materials and methods. Each IFN-related list was compared to all others using the L2L program, in order to determine the degree and statistical significance of any overlap between these ostensibly related gene lists. The figure is symmetric across the diagonal axis. Red denotes lists with up-regulation by interferon. Green denotes lists with down-regulation by interferon. Names of gene lists are as they appear in the database. Analysis of the same lists in LOLA produced highly similar outcomes (r = 0.994).