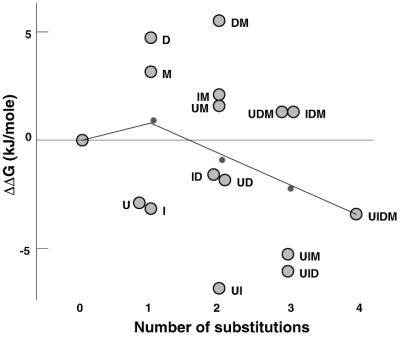
Figure 3.
Difference between the free-energy change (ΔΔGm−N°) at 22°C for binding of the substituted (m) and unsubstituted (N) DNA species to the histone. The number of bases substituted is plotted on the abscissa (i.e., 0 substitution: unmodified DNA). Abbreviations for modified DNAs are as for Fig. 1. The median values of the mono-, di-, and trisubstituted DNA species also are plotted (thick line). Data from at least three gels for each DNA were averaged to determine the free-energy difference.

