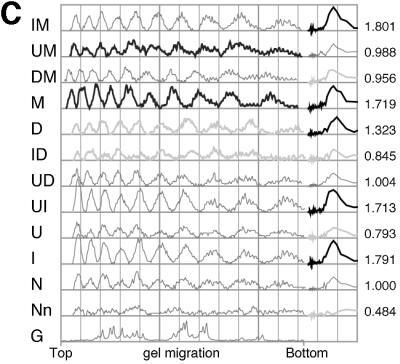
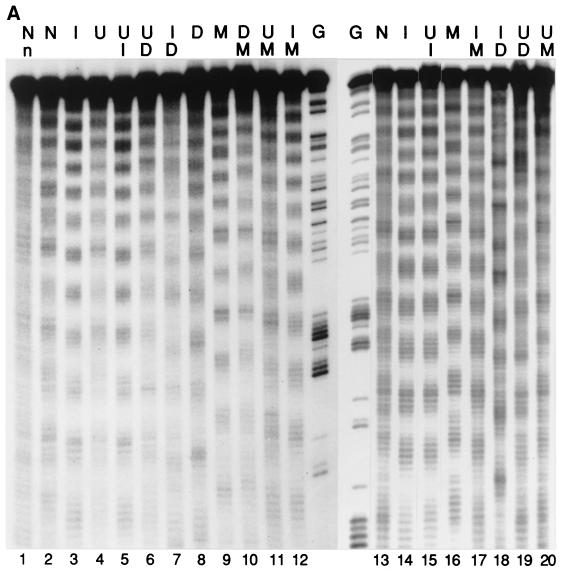
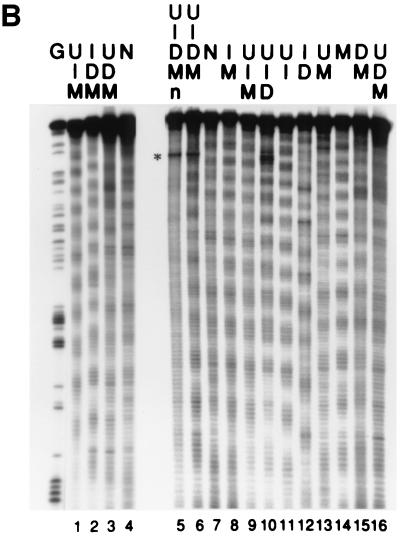
Figure 4.

Exocyclic groups affect the rotational positioning of nucleosomal particles (nps) in vitro. Nps were assembled onto 5′ labeled tyrT DNA fragments as described. All the samples were then subjected to cleavage by hydroxyl radical (24, 25), and the assembled nps with labeled specific DNA were purified by agarose gel electrophoresis. Then, DNAs were extracted and aliquots from the same sample were loaded onto different denaturing polyacrylamide gels. Typically, at least three np assembly reactions were performed for each DNA. Representative gel images are shown in A and B. The gel shown in A Left was a 6% polyacrylamide gel containing 8.3 M urea/1× TBE and contains 25% formamide to avoid band compression and thus facilitate the estimation of shifts in the rotational settings assumed by the different substituted DNAs on the histone octamer. All the other gels shown lacked formamide and also were cast by using wedge spacers (Bio-Rad) to highlight the periodicity and corresponding amplitudes of the hydroxyl-radical cleavage pattern. The nucleotide substitutions are specified as in Figs. 1 and 2. Images in A and B were spliced together using the full gel (A Left), a relevant part of gels (B), or a relevant lane from the same gel (A Right). For ease of comparison some substituted DNA species are included in more than one gel. In particular, the gel images in A and B are ordered to show the differences between substituted DNAs that adopt opposite rotational settings [D and M in lanes 8 and 9 (A) and ID and MU in lanes 12 and 13 (B); see also C]. n indicates the cleavage pattern of free DNA, and G indicates marker tracks showing the positions of guanine nucleotides in the sequence by using Maxam and Gilbert reaction. The asterisk in B indicates an artifactual band not generated by hydroxyl-radical cleavage. C shows scans of the samples shown in A Left. On the right-hand side of C the traces of the main harmonic of the Fourier transform are shown adjacent to the corresponding scan. The maximum amplitude values for each DNA from the scan shown were normalized to that of the unsubstituted DNA and are shown on the right-hand ordinate. The scale on the abscissa is in arbitrary units used by the geltrak program and is related to the gel-migration distance (26).


