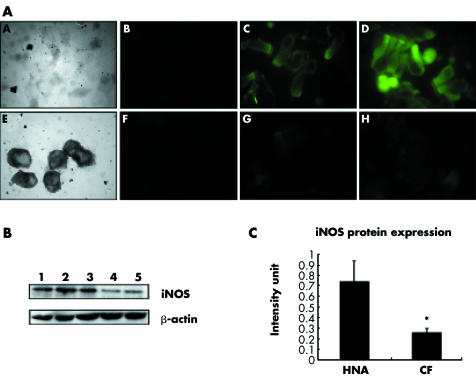
Figure 1 (A) A and E are phase contrast micrographs of epithelial cell cytospins derived from healthy non‐atopic and CF patients; B and F are negative controls for iNOS; C and D are two representative samples of endogenous iNOS expression in epithelial cells from healthy non‐atopic children (n = 15); G and H are two representative samples of endogenous iNOS expression in epithelial cells from CF patients (n = 15); magnification 1000×. (B) Western blot analysis of endogenous iNOS expression between phenotypes: lane 1, lipopolysaccharide stimulated 16HBEs; lane 2, healthy non‐atopic representative patient 1; lane 3, healthy non‐atopic representative patient 2; lane 4, CF representative patient 1; lane 5, CF representative patient 2. (C) Protein expression from the two CF patients shown in (B). Quantification of protein expression showed a significant difference (p = 0.0078) in iNOS expression between healthy non‐atopic children and those with CF. Values are mean (SD).

An official website of the United States government
Here's how you know
Official websites use .gov
A
.gov website belongs to an official
government organization in the United States.
Secure .gov websites use HTTPS
A lock (
) or https:// means you've safely
connected to the .gov website. Share sensitive
information only on official, secure websites.
