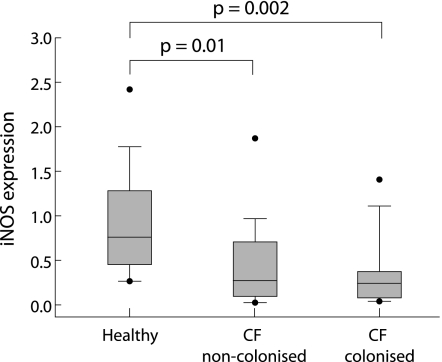
Figure 2 Expression of iNOS on epithelial cells from children with cystic fibrosis, including children with recent or past bacterial infection (⩾104 colony forming units/ml BAL fluid; n = 24), children with no infection (n = 16), and healthy children (n = 12) quantified relative to the expression of β‐actin as the housekeeping gene using TaqMan real time PCR.7,19 The lines bisecting the boxes are medians, the box limits represent 25th and 75th percentiles, whiskers extend to the 10th and 90th percentiles, and the black dots represent outliers.

An official website of the United States government
Here's how you know
Official websites use .gov
A
.gov website belongs to an official
government organization in the United States.
Secure .gov websites use HTTPS
A lock (
) or https:// means you've safely
connected to the .gov website. Share sensitive
information only on official, secure websites.
