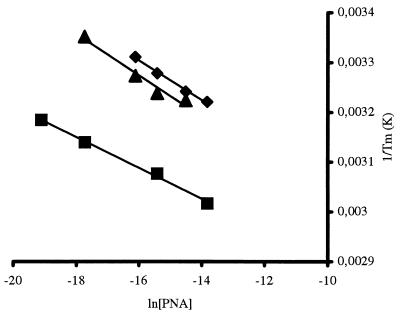
Figure 3.
Relationship between the Tm determined from curves such as those depicted in Fig. 2 and the concentration of the interacting PNA. The analysis is exemplified for the fully complementary oligonucleotide 430 (■), single mismatch mm13 (▾), and double mismatch 429 (♦).

