Figure 4.
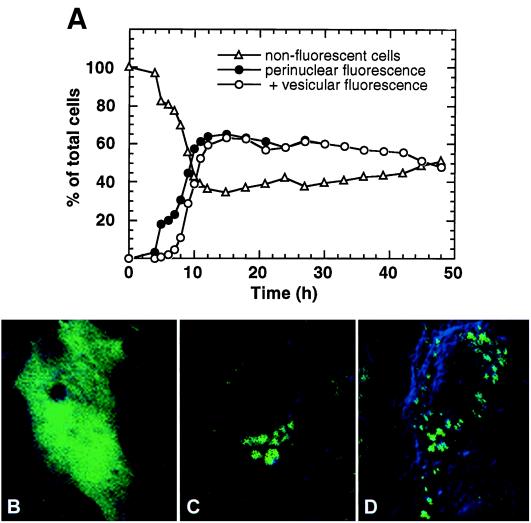
Time course expression of ARD1. NIH 3T3 cells were transfected with pEGFP-C2(ARD1) for 2 h in DMEM before culture medium with fetal bovine serum and antibiotics were added. At the indicated time after initiation of transfection, cells were incubated for 15 min at 37°C with AcR and coverslips were briefly washed with PBS before microscopic observation of living cells. Alternatively, cells were fixed and mounted before microscopy. Identical conclusions were obtained with the two procedures. (A) Cells in a planar section randomly selected were inspected and numbers of cells displaying green fluorescence in the perinuclear area and in scattered cytoplasmic vesicular structures were recorded. Cells in each category are reported as a percentage of the total number of cells counted per coverslip, which was between 217 and 380. Cell density increased slightly during the 48 h of the experiment. (B) NIH 3T3 cells expressing the cytosolic GFP 12 h after transfection. (C) NIH 3T3 cell expressing GFP-ARD1 5 h or (D) 12 h after transfection and after AcR treatment. Identical results were obtained with two different cell cultures.

