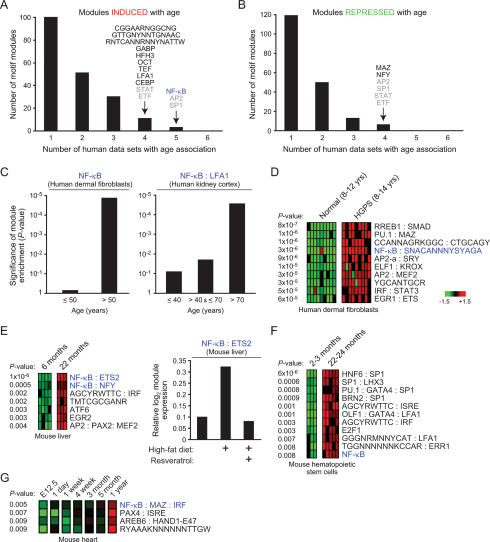
Figure 2.
Identification of NF-κB as a regulator of aging-associated gene expression programs. (A,B) Modules induced or repressed with age. Shown is the number of constituent motif modules that are induced (A) or repressed (B) with age in the indicated number of human tissues. Motifs overlapping in four or five human tissues are shown; motifs labeled in gray were found to be both induced and repressed with age in combination with different motifs. NF-κB-containing motif modules are labeled blue throughout the figure. (C) NF-κB module expression increases with chronologic age. Shown is the significance (P-value, hypergeometric distribution) of the fraction of tissue samples within each age group that demonstrates activation of the indicated module. (D) Shown are motif modules significantly induced in Hutchinson Guilford progeria syndrome fibroblasts (P-value, Student’s t-test). Each row is a motif module; each column is a microarray sample. (E, left) Motif module expression in mouse liver. Only modules with P < 0.01 are shown (Student’s t-test). (Right) Relative expression of NF-κB:ETS2 module in mouse liver after the indicated treatments. (F) Motif module expression in mouse haematopoietic stem cells (P < 0.01, Student’s t-test). (G) Motif module expression over time in mouse heart (P < 0.01, one-sided t-test).

