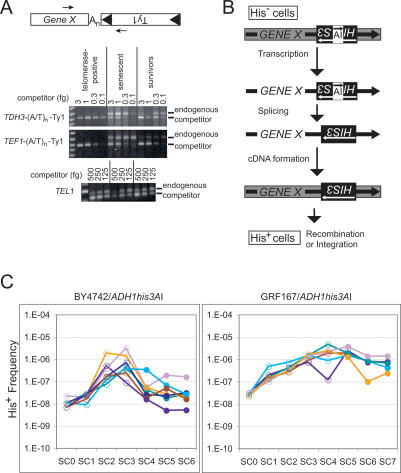
Figure 1.
Retrosequence formation becomes more frequent as telomerase-negative strains senesce. (A) Arrows in the diagram indicate the orientation of primers used to detect retrosequence cDNA junctions between sequences from the 3′ UTR of hypothetical GENE X and the 3′ end of Ty1, spanned by an oligo(A) tract, An, corresponding to the poly(A) tail of the GENE X transcript. Panels below the diagram show results of competitive PCR using equivalent amounts of genomic DNA from telomerase-positive, telomerase-negative senescent, and telomerase-negative survivor populations (BY4742 background) using primers and competitors for the indicated cDNA junctions, or with primers and competitor for the TEL1 gene (shown in bottom panel). (B) The his3AI indicator gene consists of a HIS3 gene interrupted by an artificial intron (AI) in the opposite transcriptional orientation. The his3AI gene is placed into the 3′ UTR of a gene in an orientation that allows AI to be spliced from the gene’s transcript. Formation of a functional copy of HIS3 by reverse transcription of the spliced transcript and incorporation of the cDNA into the genome produces cells that are His+ prototrophs. (C) Semi-log graphs of the frequency of His+ prototroph formation in telomerase-positive (SC0) and serially subcultured telomerase-negative derivatives (SC1–7) of strains from two different genetic backgrounds (BY4742 and GRF167) containing ADH1his3AI are shown. Open circles represent telomerase-positive and senescent populations, while filled circles represent the subculture when survivors first appeared and all subcultures thereafter, as determined by Southern analysis of telomeres of each culture at each time point (data not shown).

