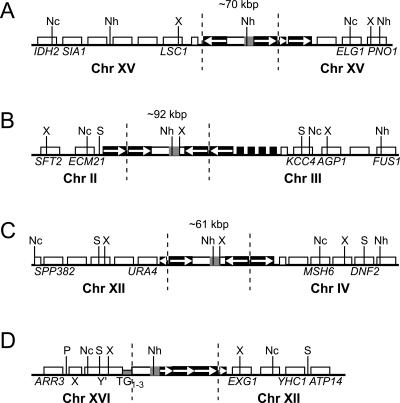
Figure 4.
ADH1HIS3 retrosequences are present at chromosome breakpoint junctions. Schematic representations of rearrangement junctions for the four chromosomes marked in Figure 2 are shown, as determined by Southern blotting of CHEF gels and inverse PCR. Chromosomes A, B, C, and D in the figure correspond to chromosomes with asterisks in lanes 3, 5, 8, and 10 of Figure 2, respectively. The chromosome of origin of sequences flanking each side of ADH1HIS3 is indicated below each drawing. Indicated sequence features correspond to sequences present in the corresponding regions of the sequenced S. cerevisiae genome (http://www.yeastgenome.org). Long, medium-length, and short white boxes represent a Y′ element, verified ORFs, and tRNA genes, respectively. Medium-length and short black boxes represent Ty1 or Ty2 elements and solo LTRs, respectively. A short gray box indicates telomeric repeats (TG1–3). ADH1HIS3 is indicated with a box containing a white region (ADH1) and a gray region (HIS3). White arrows indicate transcriptional orientations of select Ty1 sequences. Dotted vertical lines distinguish the sequences inserted through retrosequence formation from surrounding genomic sequences. Solid vertical lines indicate relevant restriction enzyme sites: NcoI (Nc), NheI (Nh), PvuII (P), StuI (S), and XbaI (X). For A, B, and C, the total number of Ty elements at the insertion site could not be determined, but the approximate size of each insertion in kilobase pairs is given, based on Southern blotting of restriction fragments separated on CHEF gels (see Supplementary Fig. S3). For the sake of simplicity, we show only a single Ty1 element flanking ADH1HIS3 in these three cases. Diagrams are not drawn to scale.

