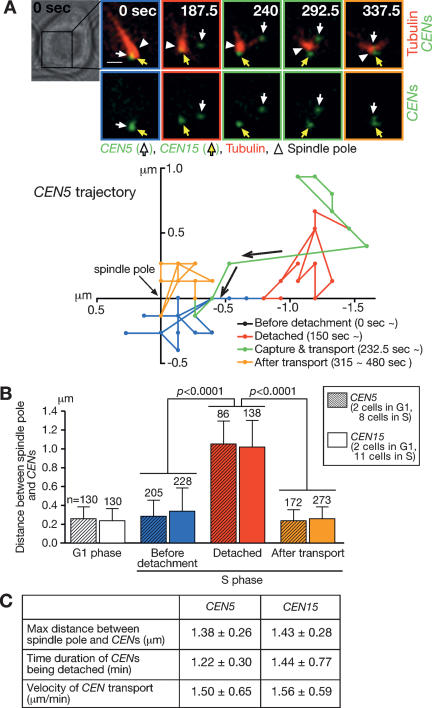
Figure 1.
Centromeres are transiently detached from microtubules and are displaced away from a spindle pole during S phase. CEN5-tetOs TetR-3CFP CEN15-lacOs GFP-LacI YFP-TUB1 cells (T4243) were treated with α-factor and subsequently released to fresh medium. After 30 min, CFP/GFP and YFP images were collected every 7.5 sec for 8 min. (A, top) Representative time-lapse images show CEN5 and CEN15 in green and microtubules in red. White arrows, yellow arrows, and white arrowheads indicate CEN5, CEN15, and a spindle pole, respectively. Time is shown in seconds in the montage (0 sec: start of image acquisition). Bar, 1 μm. (Bottom) The trajectory of CEN5 (its position relative to a spindle pole) in the same cell shown at the top is plotted along X- and Y-axes before detachment from microtubules (blue), while being detached (red), after recapture by microtubules/during transport toward a spindle pole (green) and after transport (orange; the same colors were also used to outline frames of the montage on the top). Arrows indicate the direction of CEN5 motion. (B) The distance between CEN5/CEN15 and a spindle pole was measured at each time point in two cells in G1 phase (5–13 min after release from α-factor arrest) and eight and 11 cells in S phase, where CEN5 and CEN15 were detached from microtubules, respectively. “n” denotes the number of time points of measurement. Error bars show SD. P values were obtained by comparing indicated values, separately for CEN5 and CEN15, using an unpaired t-test. (C) For CEN5 and CEN15, their maximum distance from a spindle pole (while CEN was detached from microtubules), duration of CEN detachment, and the velocity of CEN transport (mean ± SD) are shown; the data set obtained in B was analyzed.

