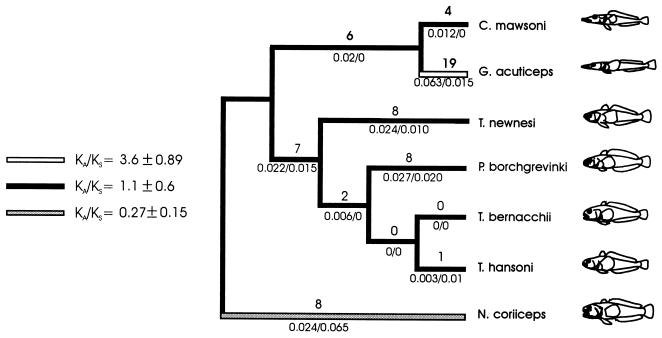
Figure 2.
KA and KS values were estimated for each branch of the globin tree with the reconstructed sequences at ancestral nodes. Numbers above lineages indicate the minimum number of amino acid substitutions to explain differences between reconstructed sequences. KA/KS ratios are shown below branches. Results from codon analysis with paml (see text) are reported on the left. Different shades on branches (white, black, and gray) refer to the different KA/KS values estimated along the tree.

